0
Skip to Content
Emissions
Grades & Sizes
Labelling
Certification
Brochures
English
CONTACT US
Open Menu
Close Menu
Emissions
Grades & Sizes
Labelling
Certification
Brochures
English
CONTACT US
Open Menu
Close Menu
Emissions
Grades & Sizes
Labelling
Certification
Brochures
English
Back
CONTACT US
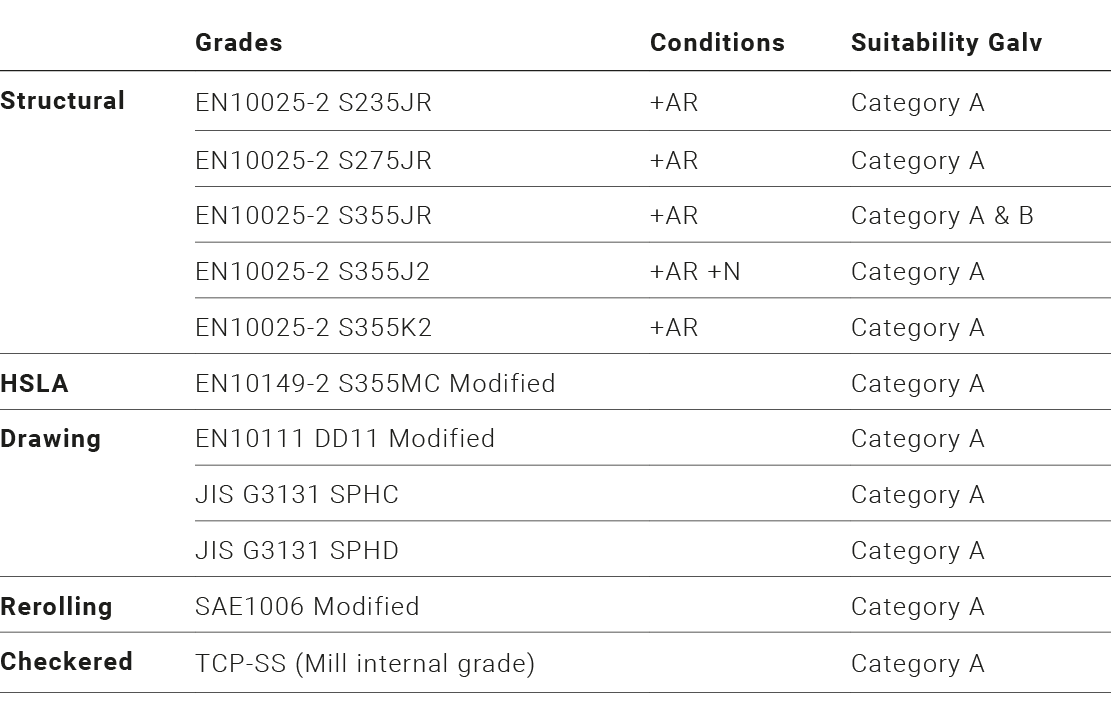
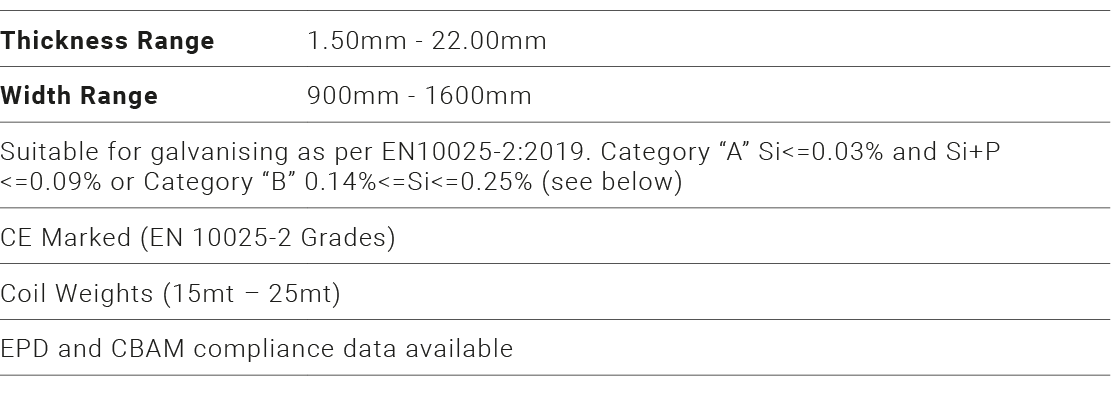
Grades & Sizes.